
Most shelter managers think their adoption problem happens at the meet-and-greet stage. They're wrong. The real bottleneck starts the moment an animal comes through your intake door, and it compounds through every handoff, every data entry, every medical check, until you're left wondering why perfectly adoptable animals sit for weeks while your kennels overflow.
Last month I mapped workflows at a mid-sized municipal shelter in Texas processing about 180 animals monthly but only adopting out 65. Not because they lacked adopters – they had waitlists for certain breeds. The problem? Their intake to adoption workflow had seventeen different choke points. Fixing just four of them increased their adoption rate by 40% in six weeks.
The uncomfortable truth about shelter operations is that most facilities run on workflows designed fifteen years ago, patched together with workarounds that made sense at the time but now create invisible barriers between animals and homes. You've got intake forms that don't talk to your medical database, behavioral assessments stuck in filing cabinets while adoption counselors rely on sticky notes, and a photo process that takes three days when it should take thirty minutes.
Why traditional shelter workflows break at exactly 150 animals
There's a specific threshold where shelter operations shift from manageable to chaotic, and it happens around 150 monthly intakes. Below that number, institutional knowledge and manual coordination can paper over process gaps. Your intake coordinator remembers which dogs need special handling, your medical team verbally updates adoption staff about cleared animals, and somehow it works.
Cross that 150 threshold though, and every missing process becomes a bottleneck. The intake coordinator can't remember every animal's status. Medical clearances get lost between shifts. Adoption counselors show animals that aren't actually ready, frustrating potential adopters who then leave empty-handed.
The breakdown isn't linear. You don't gradually get worse as numbers increase. Instead, the system holds until it suddenly doesn't, usually during kitten season or after a hoarding case, when you need efficiency most.
The real damage happens in what I call the "shadow workflow" – all the unofficial processes staff create to work around broken systems. Text messages about which animals are ready. Personal notebooks tracking medical holds. WhatsApp groups coordinating foster pickups. These shadow workflows feel like solutions, but they're actually symptoms of a broken intake to adoption workflow that's hemorrhaging efficiency at every step.
A shelter in Arizona discovered they had nine different unofficial communication channels staff were using to track animal status. Nine. When they mapped their actual workflow versus their official SOPs, they found a 70% deviation rate. No wonder animals were falling through cracks.
Mapping your actual workflow (not the one in your manual)
Broken workflows hide in plain sight. Your SOP says intake takes 20 minutes per animal. But when you actually observe the process – including the time spent hunting for cage cards, waiting for the previous animal's data to save, walking to find a working scale, calling medical to clarify vaccine protocols – it's closer to 35 minutes. Multiply that hidden fifteen minutes across 180 monthly intakes and you've lost 45 hours of staff time that could've been spent on adoptions.
Streamline your shelter operations effortlessly.
Animlly helps you manage every pet, volunteer, and adoption step with ease and accuracy.
- Comprehensive pet profiles
- Volunteer scheduling & communication
- Adoption tracking & reporting
No credit card required
Start your workflow mapping with a simple observation exercise. Pick three random animals from last month and trace their complete journey from intake to adoption or outcome. Document every touchpoint, every form, every person who handled them, every system where their data lived. You're looking for three things:
Handoff delays – Where does an animal's paperwork or information sit waiting for the next person to pick it up? Common culprits include the gap between intake completion and medical exam scheduling, or between behavior assessment and adoption floor placement.
Data silos – How many different places does the same information get entered? One shelter found they were recording weight in five different systems, none of which talked to each other.
Decision bottlenecks – Where does the process stop because someone specific needs to make a call? Usually happens around medical holds, behavior designations, or adoption pricing decisions.
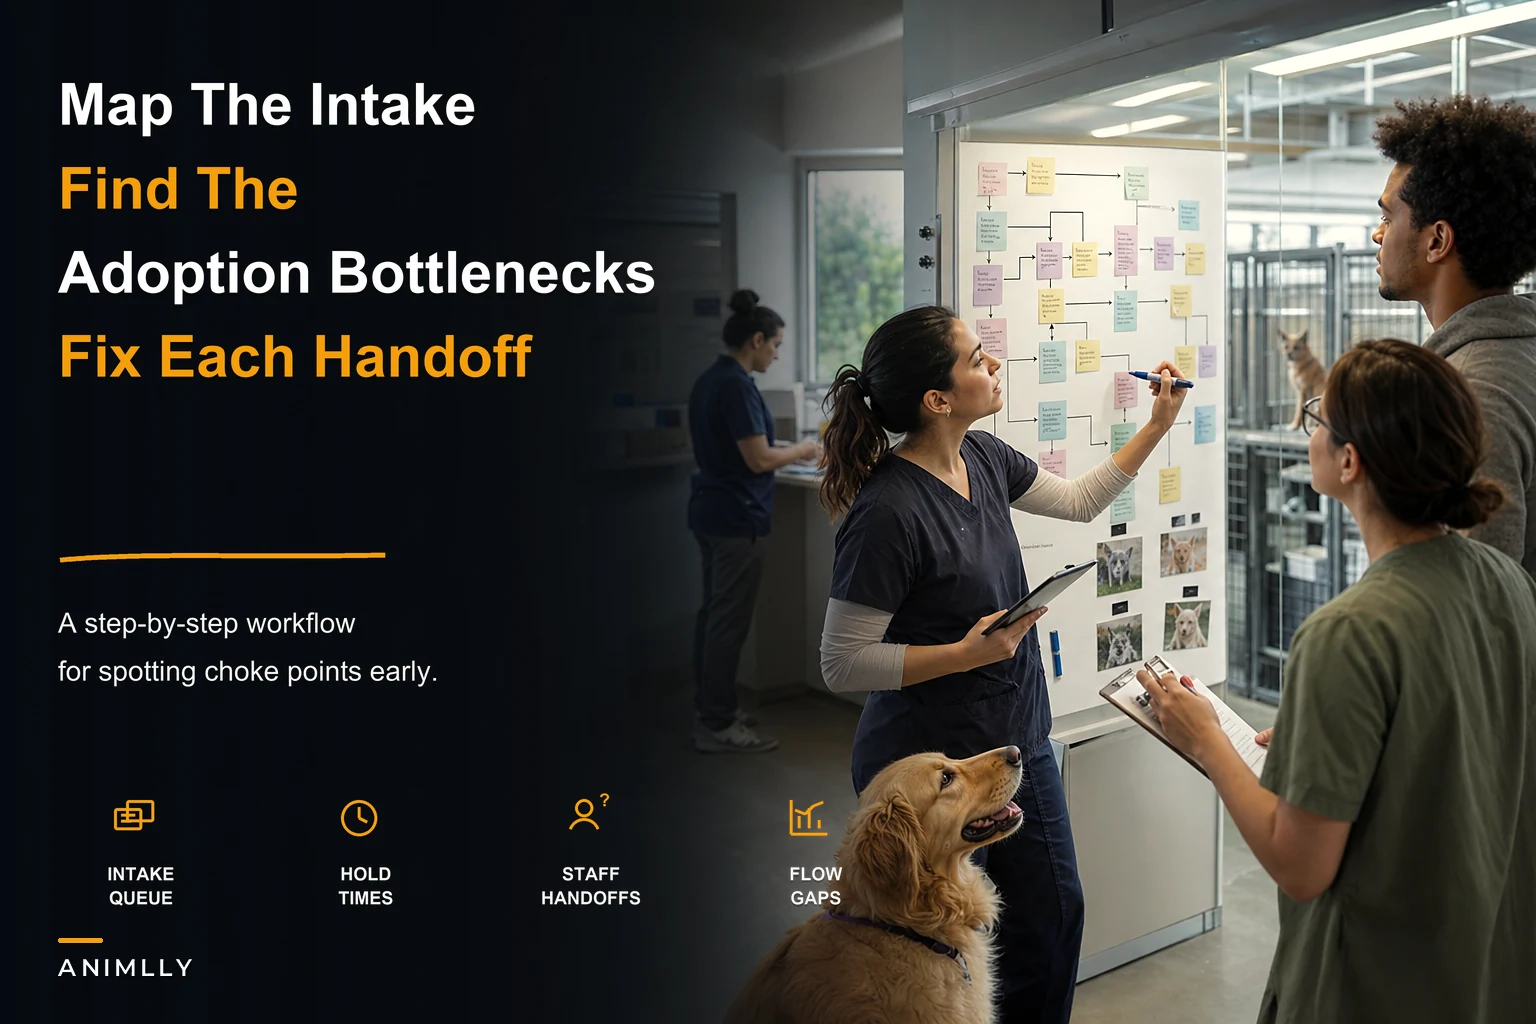
A visual overview can help teams quickly identify where handoffs and delays occur.
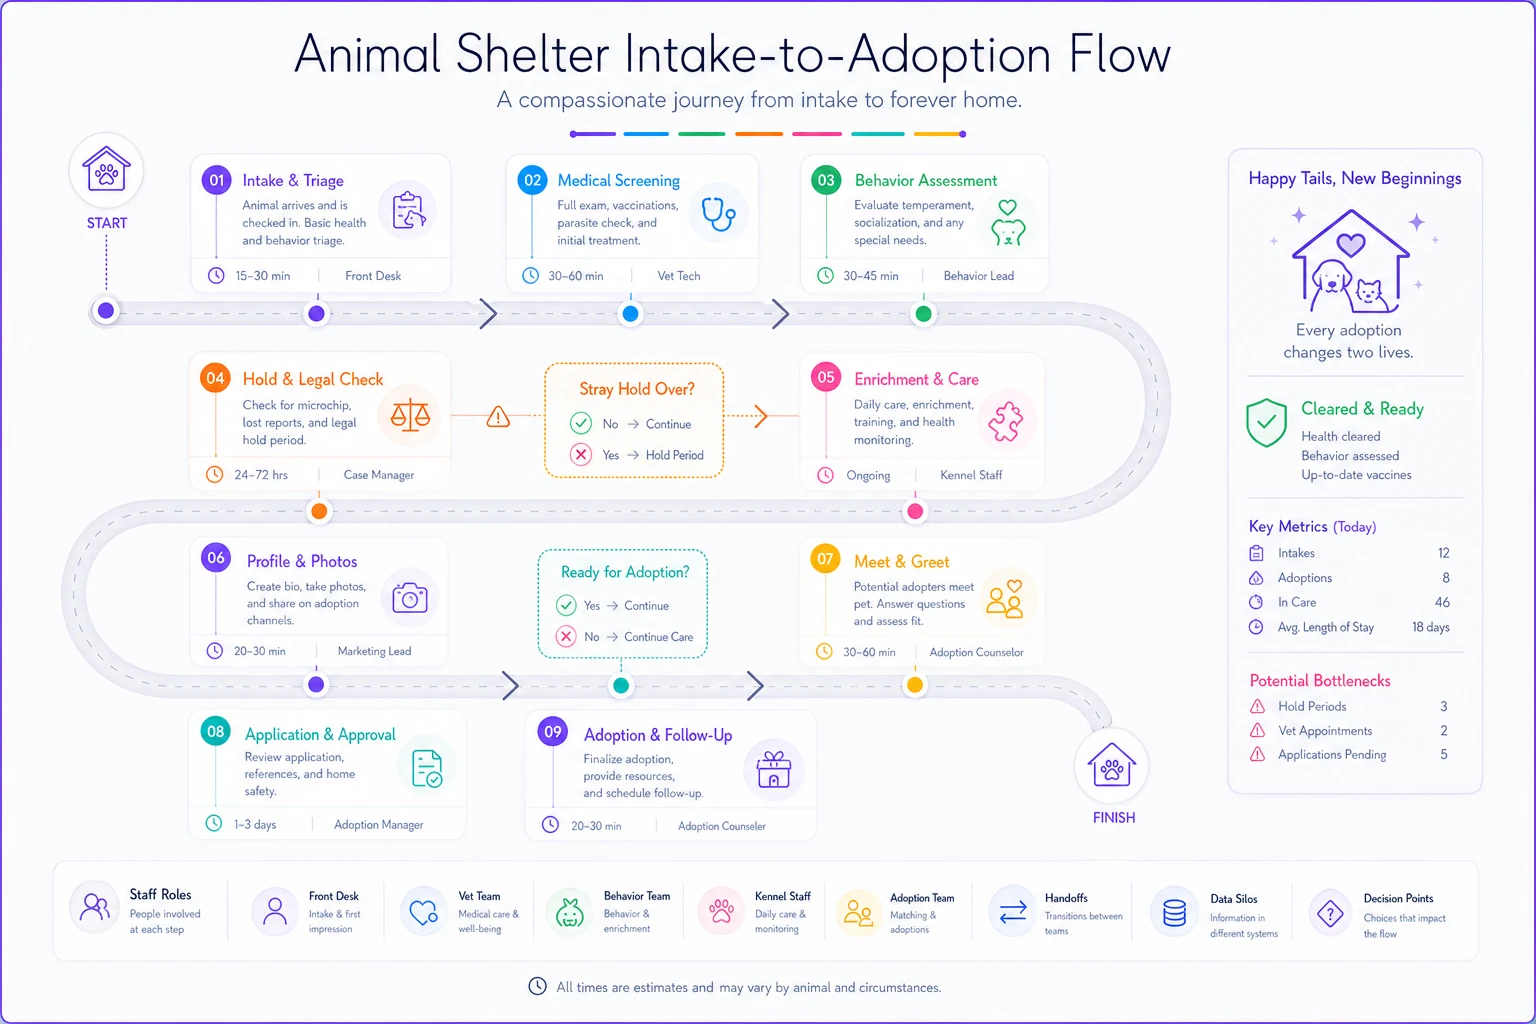
A simple visual like this makes it easier for teams to spot handoff delays and data silos.
The four bottlenecks that destroy 80% of adoption efficiency
After analyzing workflows across dozens of shelters, four specific bottlenecks consistently destroy adoption efficiency. They're not the obvious ones you'd expect.
Bottleneck 1: The intake photo delay
Sounds minor, right? But consider this: adopters start their journey online. If your animal doesn't have a photo in your system within 24 hours of intake, they're invisible to 70% of potential adopters. Most shelters take 3-4 days to get photos uploaded because they're waiting for "good" photos. Meanwhile, perfectly adoptable animals sit in kennels while adopters browse other shelters' websites.
One facility reduced their average length of stay by 5 days simply by taking intake photos with smartphones immediately during processing, even if they weren't perfect. They could always update with better photos later, but at least animals became visible immediately.
Bottleneck 2: The medical clearance void
This is the black hole where animals disappear for days. They've been examined, vaccinated, maybe even spayed/neutered, but the paperwork confirming they're adoption-ready hasn't made it to the adoption team. So the animal sits, ready but not available, because of a communication gap.
A North Carolina shelter discovered animals were sitting an average of 3.2 days post-medical clearance before hitting the adoption floor. Their fix? A simple visual flag system where cleared animals got a green tag that anyone could see from across the room. No checking files, no asking questions – green meant go.
Bottleneck 3: The foster coordination mess
Foster programs save lives, but the workflow often actively fights against success. Foster coordinators juggle spreadsheets of available homes, trying to match them with animals that may or may not be foster-appropriate, while simultaneously fielding texts from fosters about availability changes, medical needs, and adoption inquiries.
The average shelter loses 30% of foster placements to coordination failures – either the foster isn't contacted quickly enough and takes another animal, or the animal gets adopted/transferred before the foster is notified. That's not a people problem. That's a workflow problem.
Bottleneck 4: The behavioral assessment backlog
Many shelters require behavioral assessments before adoption, but only have one or two trained assessors. When those people are sick, on vacation, or overwhelmed, adoptable animals sit in limbo. Worse, some shelters require re-assessment if an animal has been in the shelter over 14 days, creating an endless cycle.
One solution that's worked for several shelters: tiered assessments. Basic safety checks that any trained staff can do for obviously friendly animals, with detailed assessments only for animals showing concerning behaviors. This cut assessment backlogs by 60% without compromising safety.
Building your bottleneck identification matrix
Creating a systematic way to identify and prioritize bottlenecks transforms random fixes into strategic improvements. Here's what actually works:
Track three metrics for every stage of your intake to adoption workflow:
Wait time – How long does an animal typically wait at this stage? Include both active processing time and idle time.
Touch points – How many different people or systems need to interact with this stage? More touch points equal more failure opportunities.
Downstream impact – If this stage delays, what else gets backed up?
Build a simple matrix:
| Workflow Stage | Average Wait Time | Touch Points | Downstream Impact | Priority Score |
|---|---|---|---|---|
| Intake processing | 35 min active + 2 hr wait | 3 people, 2 systems | Delays medical exam scheduling | 7 |
| Medical exam | 20 min active + 18 hr wait | 2 people, 3 systems | Holds adoption placement | 9 |
| Photo upload | 5 min active + 72 hr wait | 2 people, 1 system | Prevents online visibility | 10 |
| Behavior assessment | 30 min active + 4 day wait | 1 person, 1 system | Blocks adoption floor placement | 8 |
Priority score = (Wait time impact x Touch points x Downstream impact) / 10
This gives you a clear, data-driven priority list for which bottlenecks to tackle first.
Creating SOPs that actually prevent bottlenecks
Most shelter SOPs read like wish lists written by someone who's never worked a busy intake day. They assume perfect conditions, fully staffed teams, and animals that cooperate. Real SOPs need to account for chaos.
Structure for bottleneck-resistant SOPs:
The 80% rule – Your SOP should handle the 80% of normal cases smoothly, with clear escalation paths for the 20% exceptions. Don't try to account for every scenario in the main workflow.
Parallel processing – Stop thinking in purely linear terms. While an animal is waiting for their medical exam, can their photo be taken? Can their behavioral notes be started? Design SOPs that allow multiple tasks to happen simultaneously.
Clear handoff protocols – Every SOP should specify exactly how work transfers between teams. Not "medical team notifies adoption team" but "medical team places green card in holder and logs clearance in system by end of shift."
Built-in catch points – Add checkpoint stages where someone verifies critical steps are complete before animals move forward. A five-minute morning check can prevent days of delays.
When designing SOPs, prioritize parallel tasks (like photos and basic behavioral notes) that can be done during inevitable waits.
Structure SOPs for the real world, not the ideal one.
The change control checklist that prevents implementation failure
Even perfect SOPs fail without proper rollout. You need a change control process that accounts for reality – stressed staff, resistant volunteers, and the chaos of daily operations.
Phase 1: Shadow Testing (Week 1-2)
-
Run new workflow parallel to old workflow
-
Document every deviation or confusion
-
No pressure on staff to "get it right"
-
Identify the unexpected failure points
Phase 2: Partial Implementation (Week 3-4)
-
Implement new workflow for one specific subset (maybe just cats, or just owner surrenders)
-
Assign a workflow champion for each shift
-
Daily 5-minute debrief on what's breaking
-
Adjust SOP based on real-world friction
Phase 3: Full Rollout with Escape Valves (Week 5-6)
-
Implement across all animals
-
Keep old workflow as backup for overwhelming days
-
Weekly metrics review on bottleneck reduction
-
Document and share wins to build buy-in
Phase 4: Optimization (Week 7+)
-
Remove old workflow completely
-
Monthly review of metrics
-
Quarterly SOP updates based on data
-
Celebrate the improvements publicly
A phased approach with shadow testing and escape valves prevents rollout from collapsing under real-world pressure.
Measuring what matters: KPIs for workflow optimization
Stop measuring feel-good metrics that don't actually indicate workflow health. "Number of animals adopted" tells you nothing about whether your workflow is efficient. Track this instead:
Intake to availability time – How long from intake to when an animal is actually adoptable? This is your true workflow efficiency metric.
Stage completion rate – What percentage of animals complete each stage within target time? If 90% of animals get through intake in 35 minutes but only 40% get medical exams within 24 hours, you know exactly where to focus.
Handoff success rate – When work transfers between teams, how often does it happen correctly the first time? Track failed handoffs like you track medical treatments.
Shadow workflow indicators – Count the text messages, sticky notes, and "quick questions" happening outside official channels. Rising shadow workflow means your official process is failing.
Measure the right things so you can prove improvements and defend changes during budget conversations.
When workflow automation makes sense (and when it makes things worse)
The shelter industry has a complicated relationship with technology. Every software vendor promises to revolutionize your operations, but most shelters have a graveyard of partially implemented systems that now create more work than they save.
Workflow automation makes sense when you have a stable, proven process that involves repetitive data entry or communication. Auto-generating adoption packets when an animal is marked available? Perfect. Auto-scheduling medical appointments based on intake time? Probably helpful.
Where automation fails is when you try to automate broken processes. If your current workflow has animals falling through cracks, automation will just help them fall through faster. Fix the workflow first, then automate the fixed version.
The sweet spot for shelter automation is in the connections between systems. Your intake data automatically populating medical records. Behavioral notes automatically flagging specific adoption counseling needs. Foster availability automatically matching with suitable animals. These connection points are where AI-powered operational software can eliminate hours of manual coordination without requiring massive process changes.
Consider starting with something simple like automated status updates. When medical marks an animal as cleared, adoption staff get notified immediately. When a foster confirms availability, matching animals are automatically flagged. These small automations can cut your bottleneck resolution time in half without overwhelming staff with new technology.
Common implementation failures and how to avoid them
The graveyard of failed workflow improvements is full of good intentions. Patterns that predict failure:
The hero dependency – One super-engaged staff member drives the entire change, then burns out or leaves. Build changes that survive personnel changes.
The perfect system trap – Waiting to implement until every detail is figured out. Start with 70% solutions and iterate.
The technology-first approach – Buying software before mapping workflows. You'll end up forcing your operations to match the software's assumptions.
The all-or-nothing rollout – Changing everything at once creates chaos. Phase your implementation to maintain stability.
The measurement desert – Not tracking whether changes actually improved outcomes. You need data to defend improvements during tough budget conversations.
Avoid these patterns and you dramatically increase the chance your changes stick.
Your 30-day bottleneck elimination plan
Week 1: Observation and mapping
-
Track 10 animals through complete workflow
-
Document every delay and handoff
-
Build your bottleneck matrix
-
No changes yet, just observation
Week 2: Quick wins
-
Fix the one bottleneck you can address without new SOPs
-
Usually this is a communication gap or simple tool issue
-
Measure the impact immediately
-
Share the win with staff
Week 3: SOP development
-
Draft new procedures for your top priority bottleneck
-
Test with your most flexible team first
-
Incorporate feedback daily
-
Keep the old process as backup
Week 4: Gradual expansion
-
Roll new SOP to all teams
-
Monitor metrics daily
-
Address resistance with data, not arguments
-
Document lessons learned
After 30 days, you should see measurable improvement in at least one major bottleneck. Use that success to build momentum for tackling the next one.
The compound effect of incremental improvements
A 10% improvement in five different workflow stages doesn't give you a 50% improvement overall – it gives you closer to 61% because the effects compound. When intake processes animals 10% faster, medical gets them 10% sooner, which means they clear for adoption 10% quicker, and so on through the entire workflow.
This is why small improvements matter more than you think. That five-minute delay in photo uploads might only seem like five minutes, but it cascades through your entire operation, affecting online visibility, adopter interest, length of stay, and ultimately your life-saving capacity.
The shelters seeing the most dramatic improvements aren't the ones making huge sweeping changes. They're the ones consistently identifying and eliminating small bottlenecks, week after week, until their workflow runs like a well-oiled machine.
Your intake to adoption workflow doesn't need to be perfect. It just needs to be 10% better next month than it is today. Stack enough of those 10% improvements, and you'll transform your life-saving capacity without adding a single kennel or hiring a single person.
The animals in your care can't wait for the perfect solution. They need the incremental improvements you can implement tomorrow. Start with observation, identify your biggest bottleneck, and fix it. Then do it again. That's how you build a workflow that saves more lives.
The animals in your care can't wait for the perfect solution. They need the incremental improvements you can implement tomorrow. Start with observation, identify your biggest bottleneck, and fix it. Then do it again. That's how you build a workflow that saves more lives.
Ready to enhance your shelter’s impact?
Join 500+ shelters using Animlly to improve care coordination, increase adoptions, and engage communities effectively.