
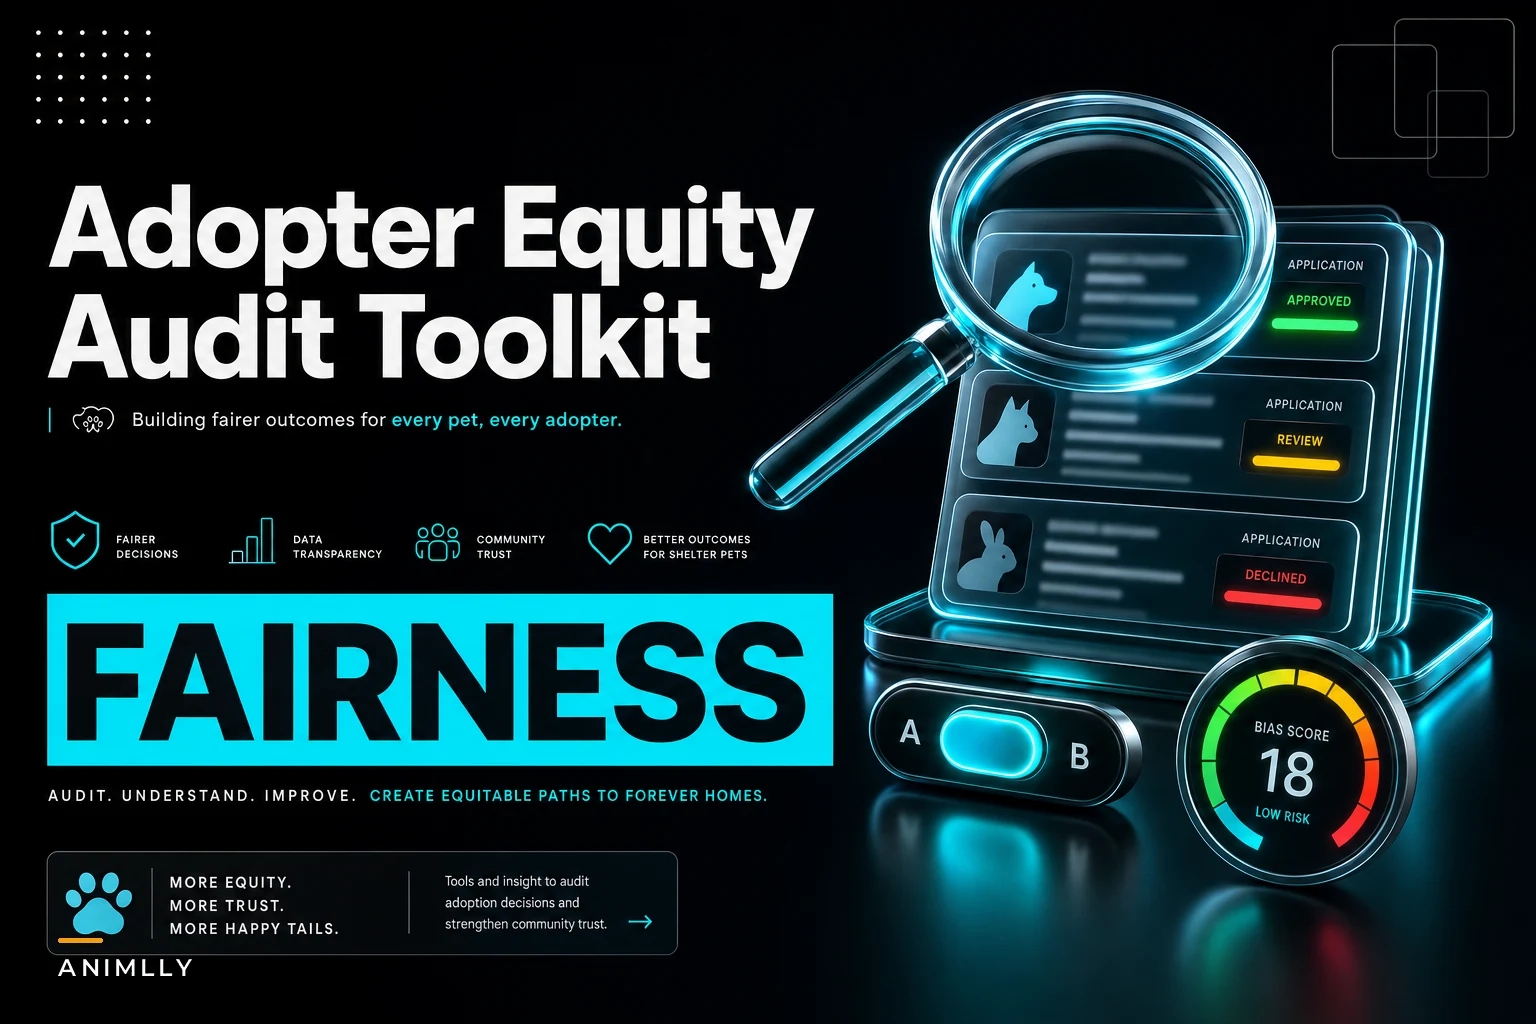

Screening bias almost never looks like bias from the inside. Nobody at the front desk decides "we approve fewer applicants from this zip code." What happens is quieter: one coordinator reads "lives in an apartment" as a yellow flag, another doesn't. A volunteer sees "renter" and asks three extra verification questions they'd skip for a homeowner. Multiply those small judgment calls across a few hundred applications and you get a pattern nobody intended and nobody can see without actually stopping to look.
You don't need a data scientist or a fancy dashboard to catch it. You need about ten minutes, a spreadsheet export, and the willingness to look at your own approval rates honestly. This toolkit walks through the exact queries, the thresholds worth pausing on, and a few simple change experiments to test whether a fix actually worked.
Scope here is deliberately narrow: detecting and reducing bias in adoption screening decisions. Not intake, not outreach, not pricing. Just the yes/no/conditional moment when someone applies to adopt.
Why screening bias hides so well
The core problem is that screening decisions are distributed and mostly verbal. In most small shelters, three to six different people make approval calls, and a lot of the reasoning never gets written down. Someone denies an application and notes "not a good fit" or "concerns about setup." Those phrases are invisible to any audit because they don't encode what the concern was or whether you'd apply the same standard to the next applicant.
-
Proxy variables. Housing type, income documentation, fenced-yard requirements, and "landlord approval" aren't biased on paper, but they correlate strongly with age, race, and class. A fenced-yard rule for medium dogs quietly filters out apartment-dwellers and renters.
-
Reviewer drift. Two coordinators approving the same application type at noticeably different rates. One approves 85% of first-time adopters; another approves 60%. Same shelter, same week.
-
Conditional-approval creep. Certain applicant groups get approved "with a home check" or "with a trial" far more often — extra friction that isn't officially a denial but produces the same drop-off.
This persists not because of bad intent, but because nobody ever runs the comparison. Approval decisions feel individual and reasonable in the moment. Bias only becomes visible in aggregate, and aggregates are exactly what busy shelters never stop to compute.
The real cost of not looking
An adopter-equity audit isn't a compliance exercise — it's directly tied to live-release outcomes. Every applicant turned away for a soft, unexamined reason is an animal that stays in a kennel longer, and length of stay is the single biggest driver of both cost and behavioral decline.
Streamline your shelter operations effortlessly.
Animlly helps you manage every pet, volunteer, and adoption step with ease and accuracy.
- Comprehensive pet profiles
- Volunteer scheduling & communication
- Adoption tracking & reporting
No credit card required
Here's roughly how the math works. Say you process around 600 adoption applications a year and deny or heavily condition about 18% of them. If even a quarter of those denials are driven by inconsistent screening rather than genuine welfare concerns, that's somewhere around 25–30 adoptions a year you lost for no defensible reason. At the $15–25/day kennel costs most shelters quote, each extra 10 days per animal adds up fast — and that's before counting the reputational hit when a denied applicant posts about their experience online.
There's also a slower cost. Communities notice who gets approved. When applications from a particular neighborhood keep bouncing, people stop applying, and your adoption pool narrows to the demographics you already serve. That shrinks your outcomes and feeds back into the welfare and community-impact metrics you're probably already tracking in your shelter outcome measurement framework.
The ten-minute audit: three queries you can actually run
You don't need to anonymize applicants by name for this to work — you need to anonymize them from yourself while looking at the pattern. Strip the narrative and look only at structured fields: outcome, reviewer, housing type, zip code, any applicant group markers you already collect.
Three queries. Run them on any export from your adoption management system, or build them by hand in a spreadsheet if needed.
Query 1 — Approval rate by reviewer. Group all decisions from the last 90 days by the person who made the call. Compute approval rate for each. You're looking for reviewers whose rates sit more than about 15 percentage points off the team median.
Query 2 — Approval rate by proxy field. Pick one proxy at a time: housing type (own vs. rent), zip-code cluster, or whether income/landlord verification was requested. Compare approval rates across groups. A gap larger than roughly 10–12 points is your trigger to dig in.
Query 3 — Conditional-approval load by group. Among approved applications, what share got a condition attached (home check, trial, extra references)? Compare across the same groups as Query 2. If one group carries conditions at twice the rate of another, that's friction worth examining even though nobody was formally denied.
| Audit signal | What you're measuring | Threshold that should make you pause |
|---|---|---|
| Reviewer spread | Approval rate per coordinator | >15 pts from team median |
| Proxy gap | Approval rate across housing/zip groups | >10–12 pt gap |
| Conditional load | % of approvals with conditions, by group | One group ≥2x another |
| Denial reason entropy | How many distinct written reasons exist | Fewer than ~5 reasons across all denials |
That last row is easy to overlook. If 40 denials all collapse into two or three vague reasons — "not a fit," "home concerns" — you don't have a reason system. You have a vibe, and vibes are where bias lives.
A worked example
A mid-size municipal-contract shelter pulled 90 days of data and ran exactly these three queries one afternoon. About 410 applications, four reviewers.
Query 1 surfaced the first surprise: one reviewer approved first-time adopters at 58% while the team median sat near 79%. Not malicious — she genuinely believed she was being careful. But "careful" was landing almost entirely on renters and younger applicants.
Query 2 confirmed it. Renters were approved at 64%; owners at 86%. A 22-point gap, well past the trigger. When they looked at the denial notes, the renter denials clustered around "unable to confirm landlord approval" — a requirement that, in practice, nobody was helping applicants actually satisfy. They were just marking it unverified and moving on.
The fix wasn't a policy rewrite. They added one step: when landlord approval was the only open item, the coordinator sent a pre-written verification text and gave it 48 hours before deciding. Over the next quarter the renter approval gap narrowed to about 9 points, and total adoptions ticked up by roughly 30 compared to the same window the prior year. No standards were lowered — a friction point was removed.
Turning findings into A/B change experiments
Finding a gap is the easy part. The mistake most shelters make next is overreacting — rewriting the whole screening policy based on one audit, with no way to tell if it helped. Treat each fix as a small experiment instead.
-
Pick one lever. Change exactly one thing — e.g., replace the fenced-yard requirement for medium dogs with a fenced-yard conversation about exercise plans. One variable, nothing else.
-
Split by time, not by applicant. Run the old process for two weeks, the new process for the next two weeks. Splitting live applicants into A/B groups is ethically dicey in adoption; alternating time blocks is cleaner and fairer.
-
Pre-declare your metric. Decide before you start what success looks like: approval-gap narrowing, no rise in returns, no rise in post-adoption complaints. Write it down so you can't move the goalposts later.
-
Watch the guardrail metric. Returns within 30 days is your safety net. If a screening change loosens things and returns climb, you'll see it quickly — and you should already have follow-up workflows in place to catch it.
-
Keep or roll back. If the gap narrowed and returns held steady, keep the change and document it. If not, revert and try a different lever.
The whole point is that you're testing process changes, not making permanent policy bets. A reviewer whose approval rate was an outlier might just need calibration — three reviewers going through the same ten anonymized applications and comparing notes usually does more than any written rule.
When this audit makes sense — and when it doesn't
When it makes sense: You've got more than one person making screening calls, you process enough applications monthly to have real patterns (roughly 20+), and you capture structured outcome data. This is also exactly the right move if a denied applicant has already complained publicly and you need to know, honestly, whether they had a point.
When it's a bad idea: If you only have one coordinator and a handful of applications a week, the numbers are too thin to mean anything — you'll chase noise. Spend that energy writing down clearer denial reasons instead, which builds the data you'll need to audit later.
Anyone hoping to run this once and declare victory is setting themselves up for drift. New volunteers bring new personal thresholds. Screening standards that feel clear in one season get fuzzy six months later when staff turns over. Running this quarterly catches drift before it hardens into culture.
Keeping it light enough to actually repeat
The reason most equity efforts die isn't disagreement — it's effort. If the audit takes a day, it happens once and never again. The whole design here is built around ten minutes a quarter using data you already collect.
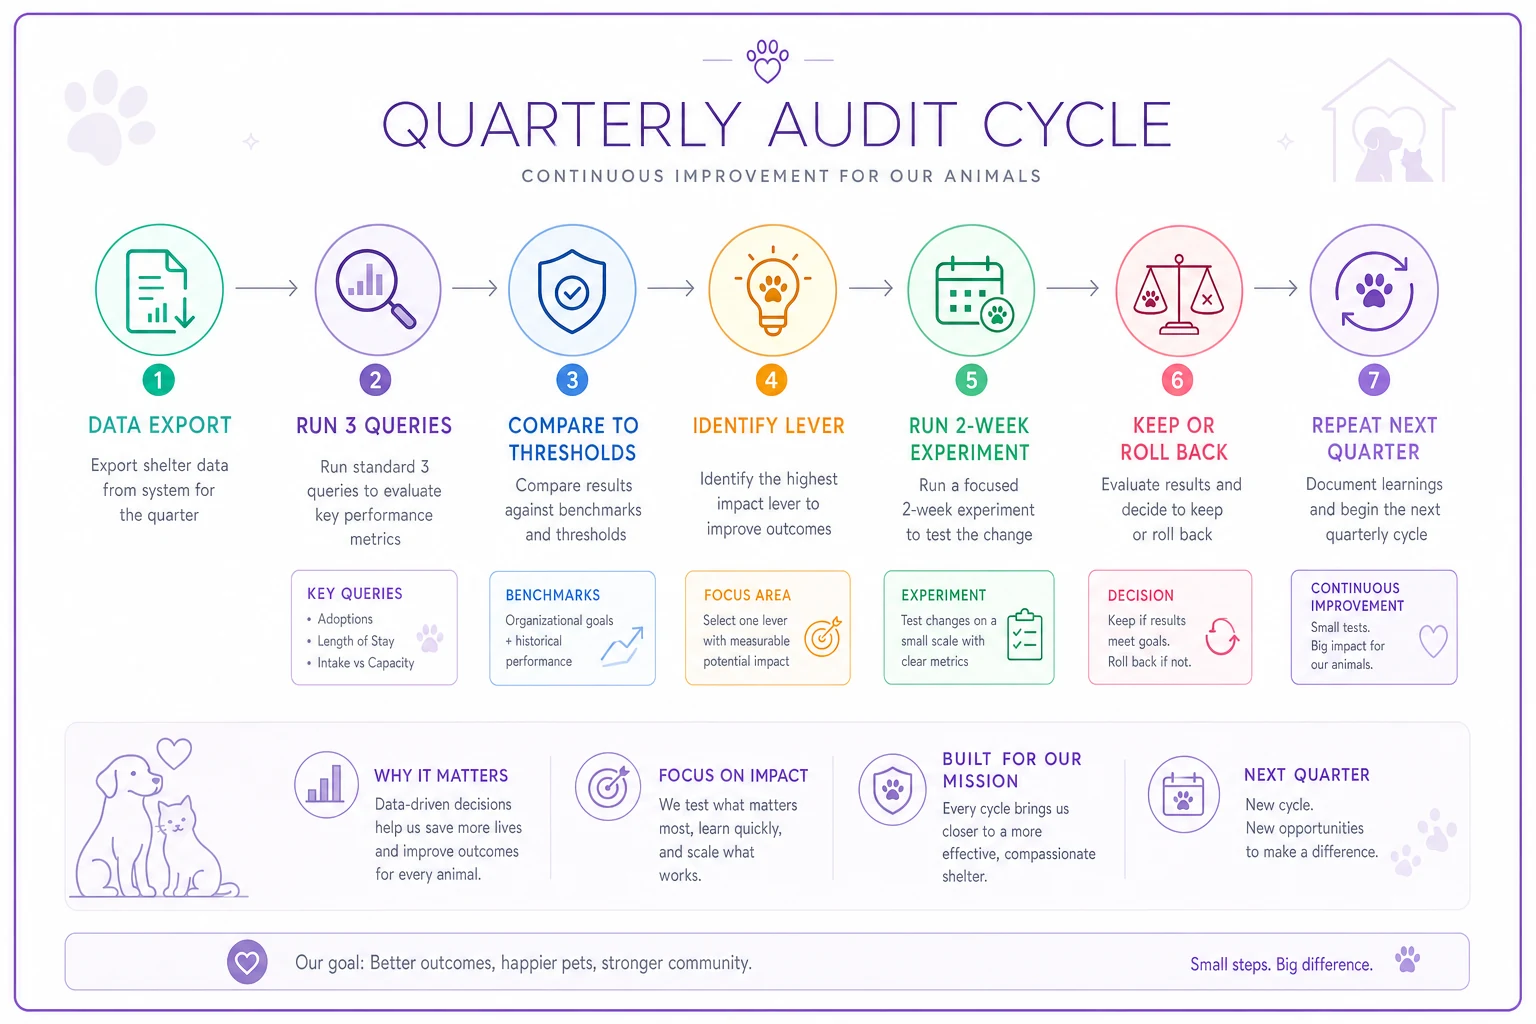
Where operational software helps is in removing the manual export-and-spreadsheet grind. If your adoption records already live in a workflow platform, you can set the three queries up once as saved views — approval rate by reviewer, by housing type, by conditional load — and have them recompute automatically. Some teams add a simple threshold alert so that when a reviewer's rate drifts past that 15-point band, it surfaces on its own rather than waiting for someone to remember to look.
That's the realistic role for automation here: not making the decision, just making sure the pattern can't stay invisible. The judgment stays human; the audit just stops being something you forget to run.
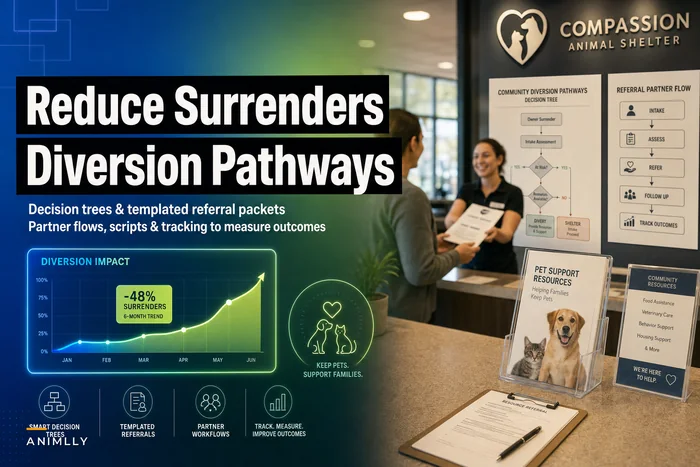
The deeper fix is upstream anyway. A lot of what reads as screening bias is really a lack of alternative pathways — when the only options are "approve" or "deny," borderline applicants get denied. Shelters that pair this audit with real community diversion and resource pathways tend to see fewer hard denials overall, because coordinators have something to offer besides a yes or a no.
The short version
Screening bias in shelters is rarely a values problem and almost always a visibility problem. The reasoning is distributed across people and buried in vague notes, so nobody can see the aggregate pattern their individual calls add up to.
Pull three simple queries, set a few honest thresholds, test changes two weeks at a time with a returns guardrail, and you'll surface most of what's there — without analytics training, without accusing anyone, and without turning a ten-minute check into a quarterly project that quietly gets abandoned.
Run it once this week. Then put it on the calendar for ninety days out. The second run is where the real value shows up, because that's when you find out whether the thing you changed actually worked.
Run it once this week. Then put it on the calendar for ninety days out. The second run is where the real value shows up, because that's when you find out whether the thing you changed actually worked.
Ready to enhance your shelter’s impact?
Join 500+ shelters using Animlly to improve care coordination, increase adoptions, and engage communities effectively.